Overview
The Intelligence Dashboard provides a centralized view of important Salesforce activity, health, and security indicators. It helps admins monitor org behavior, detect risk, track usage, and gain visibility into system changes—all in one place. Alerts can also be enabled to monitor changes and risk events in Salesforce.
Watch a quick demo on it here!
Navigation
Accessing the Dashboard
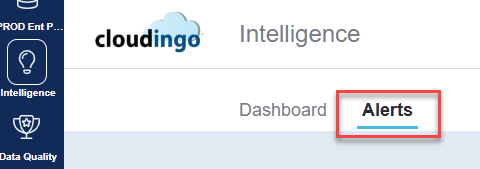
From the left-hand navigation panel, select Intelligence.
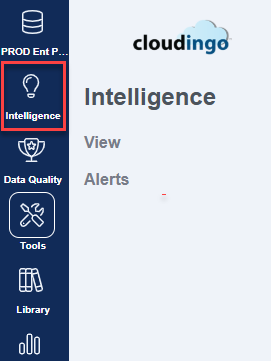
Note: Icon appearance indicates alert detection:
Non-illuminating: no alerts are currently detected.
Illuminating: alerts are currently detected.


View: Opens the Dashboard tab by default (with option to switch to Alerts).
Alerts: Opens the Alerts tab by default (with option to switch to Dashboard).
Dashboard Overview
Each report tile provides intelligence metrics about your Salesforce organization.
Tile Indicators
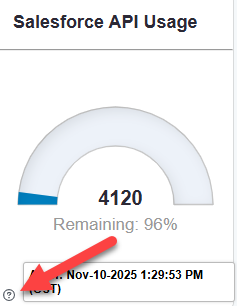
Last Data Pull: A question mark (?) icon in the bottom-left corner shows when the data was last refreshed.
a. If no timestamp appears, the report displays real-time data.
Full Report Option: A Full Report link in the bottom-right corner opens the detailed underlying data.
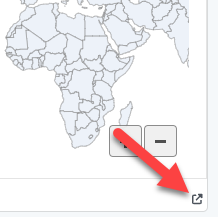
a. If not available, the current display shows all data.
Salesforce Logins
Displays login activity and locations of users accessing the Salesforce org.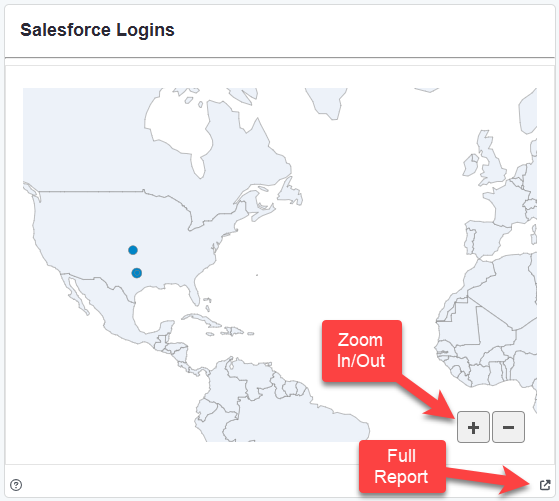
Use + / – to zoom in or out.
Use the Full Report to view detailed login data.
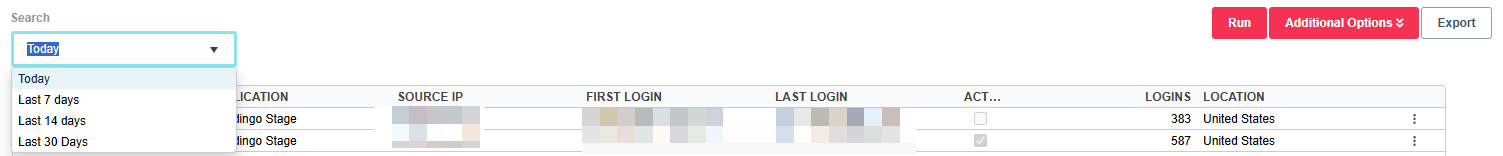
Choose a date option in the Search box.
Choose ‘Run’ to re-run the report using the specified date option selected.
Choose ‘Additional Options’ to narrow down search criteria.

Choose ‘Reset’ to clear out specific search criteria.
Choose ‘Export’ to export the list in view.
Output Fields (Full Report)
Field | Description |
|---|---|
User | Name of the user or third-party app logged in. |
Application | Browser or app used for login. |
Source IP | IP address of the login source. |
First Login / Last Login | Dates of first and most recent logins. |
Active | Indicates whether the user is currently logged in. |
Logins | Number of total logins within the recorded timeframe. |
Location | Country of login origin. |
Reasons to Monitor:
Data Security: Detect unauthorized access locations.
API Activity: Identify apps consuming Salesforce API resources.
Trust Status
Displays real-time operational data from the Salesforce Trust site.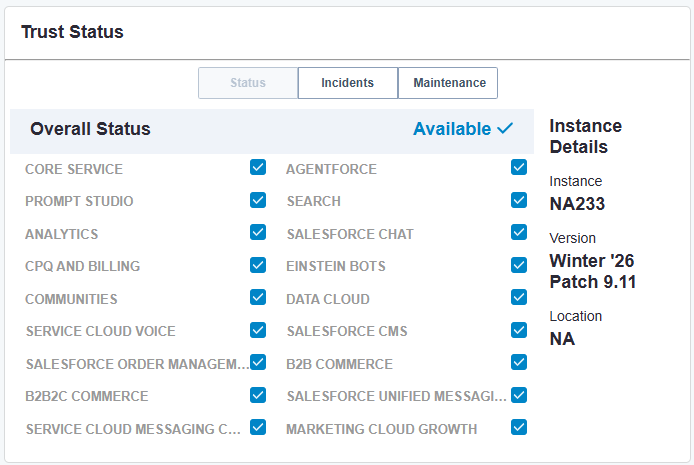
Output Fields
Field | Description |
|---|---|
Status | Current real-time instance status. |
Incidents | Active or past incidents listed by Salesforce. |
Maintenance | Current or upcoming scheduled maintenance. |
Instance Alerts | Enable notifications for incidents or maintenance windows. |
Salesforce API Usage
Displays the total and remaining API calls available in your org for the current 24-hour period.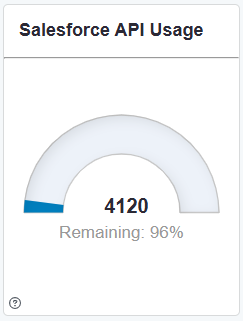
Installed Applications
Lists all managed packages installed in your Salesforce org.
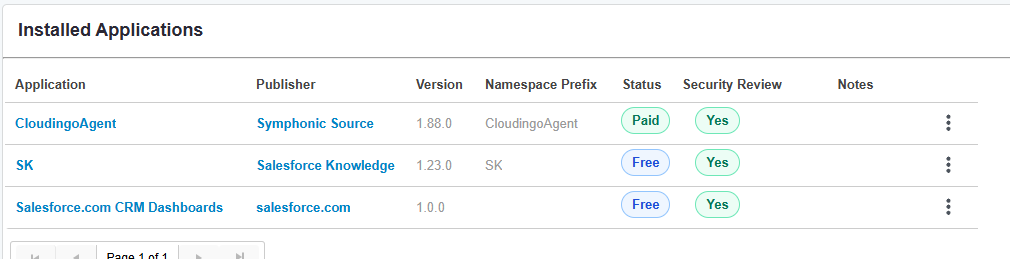
Output Fields
Field | Description |
|---|---|
Application | Name of the installed app. |
Publisher | Vendor or publisher of the app. |
Version | Installed version number. |
Namespace Prefix | Prefix used in logs (flows, triggers, processes). |
Status | Indicates app type (Paid, Free, Active, etc.). |
Security Review | Displays “Yes” if the app passed Salesforce Security Review. |
Notes | Displays potential issues (e.g., expired API versions). |
Menu Options
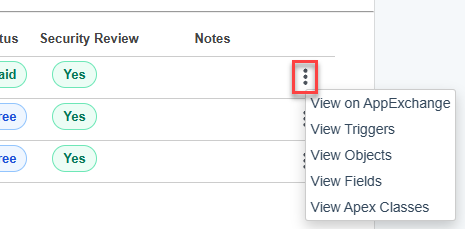
1. View on AppExchange: Opens the Salesforce AppExchange listing.
2. View Triggers / Objects / Fields / Apex Classes: Displays the related components in Salesforce.
Network Access (Salesforce IP Whitelist)
Displays all IP ranges whitelisted in your Salesforce org.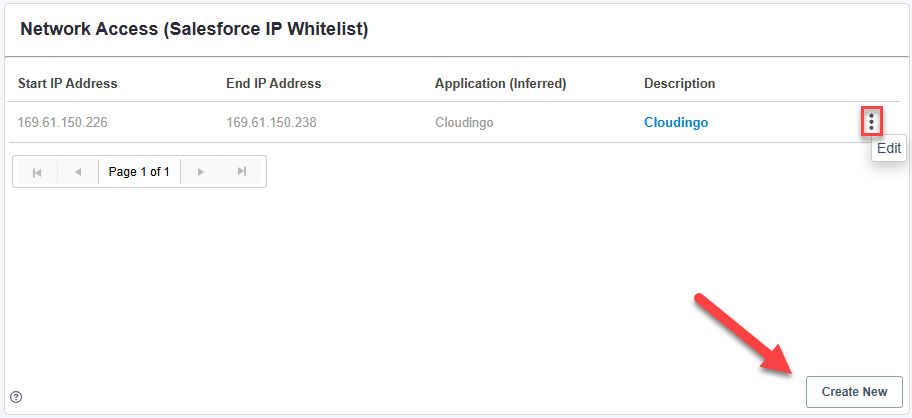
Output Fields
Field | Description |
|---|---|
Start IP / End IP | Defines the whitelisted IP range. |
Application | Automatically tagged by Cloudingo if identifiable. |
Description | Optional user-defined note for the IP range. |
Menu Options
Edit: Modify the specified IP range or the description directly in Salesforce.
Create New
Create a new whitelisted IP Range directly in Salesforce.
Custom Salesforce Classes and Triggers
View and monitor all custom Apex Classes and Triggers within your Salesforce org.
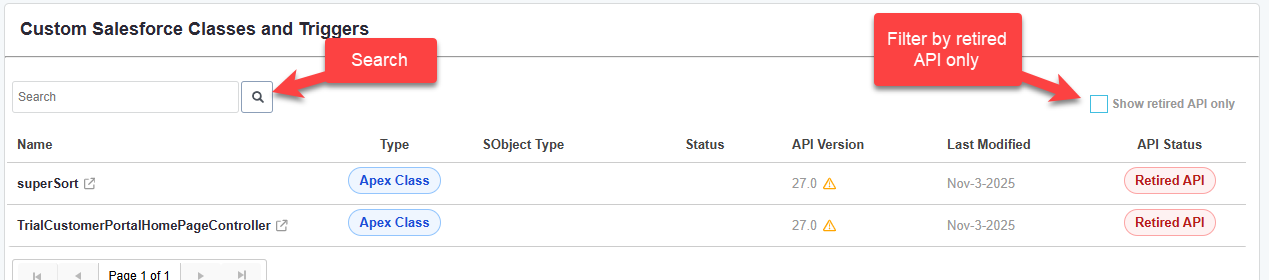
Use Search to locate by full or partial name.
Enable Show Retired API Only to display deprecated API versions.
Output Fields
Field | Description |
|---|---|
Name | Trigger or class name (click arrow to open in Salesforce). |
Type | Trigger or Apex Class. |
SObject Type | Object the process applies to. |
Status | Active or Inactive. |
API Version | API version the process was created for. |
Last Modified | Last updated date. |
API Status | Current or Expired (expired items may require action). |
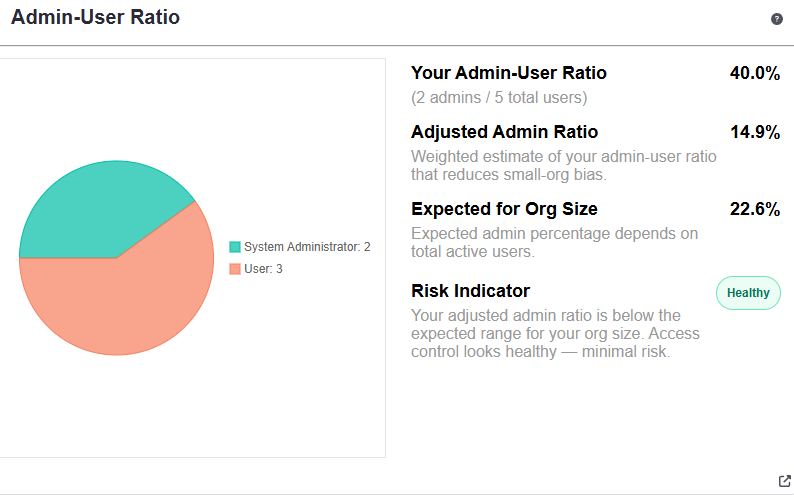
Admin-User Ratio
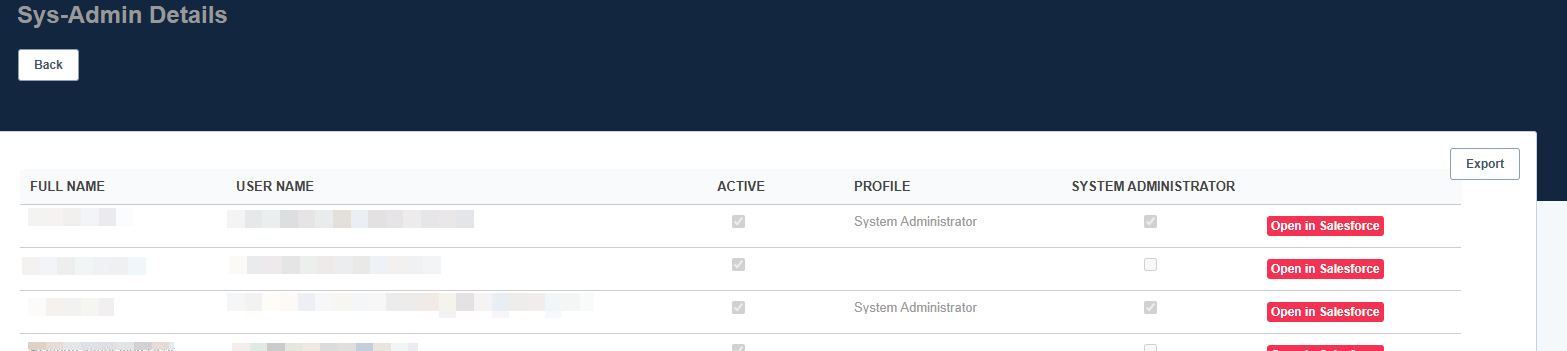
Output Fields (Full Report)
Field | Description |
|---|---|
Full Name | Full name of the individual Salesforce user(s). |
User Name | Salesforce username of the individual Salesforce user(s). |
Active | Active in Salesforce (checked if active, unchecked if inactive). |
Profile | Salesforce Profile assigned to the individual user. |
System Administrator | System Administrator status in Salesforce (checked if applicable) |
Choose ‘Open in Salesforce’ to open the user record in Salesforce directly.
Choose the ‘Export’ option to export the full list to a CSV file.
Reasons to Monitor:
Assess the balance between administrators and users in the organization.
A well-balanced ratio can positively impact data quality by ensuring adequate oversight and support.
A low admin-user ratio might indicate challenges in managing data hygiene across the organization.
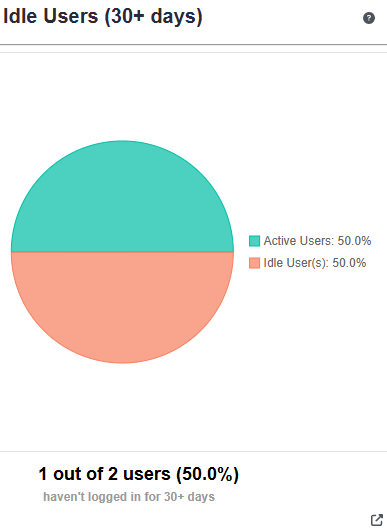
Idle Users (30+ days)
Output Fields (Full Report)

Field | Description |
|---|---|
Name | Name of the individual Salesforce user(s). |
Email of the individual Salesforce user(s). | |
Profile | Salesforce Profile assigned to the individual user. |
Last Login | Last Salesforce login date for the individual user(s). |
Choose ‘Open in Salesforce’ to open the user record in Salesforce directly.
Choose the ‘Export’ option to export the full list to a CSV file.
Reasons to Monitor:
Monitor those who are not actively using Salesforce on a regular basis.
Identify and deactivate users who no longer require access.
Alerts Overview
1. Enable alerts to monitor Salesforce activity and configuration changes.
2. By default, alerts appear in the Active Alerts section of the Alerts tab.
3. Email notifications to a specific list of recipients can also be configured.
Settings
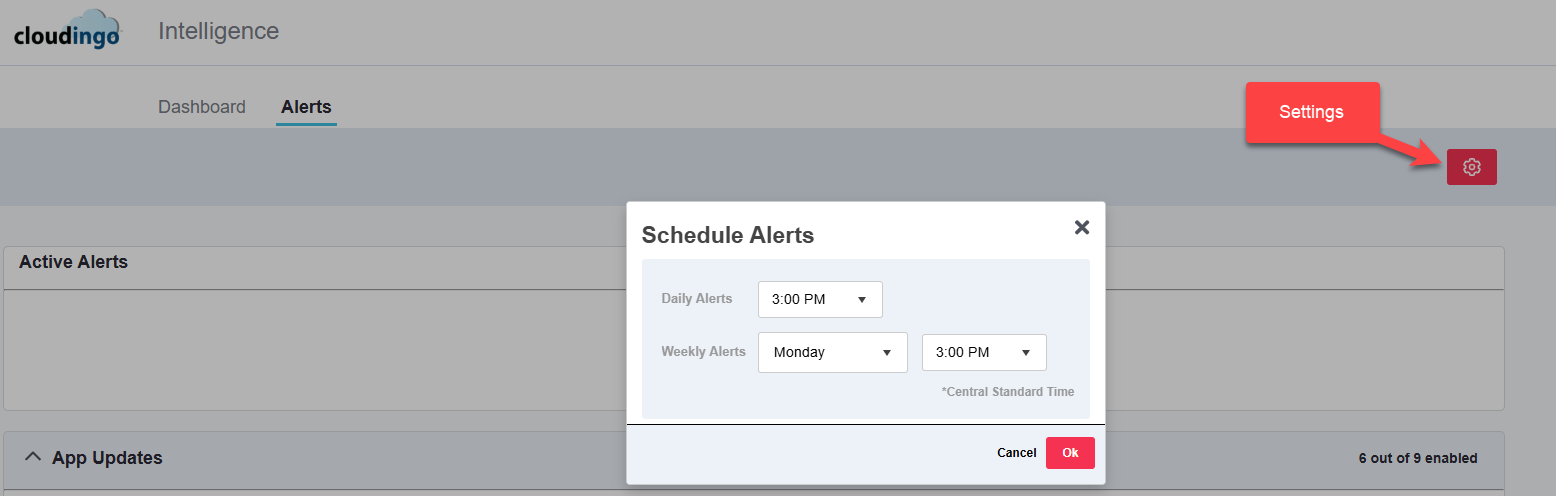
Choose the day and/or time for daily or weekly email alerts to be sent (if applicable; see Email Notification Options under the Alert Settings section below).
Schedules must be set at least 30 minutes apart.
Active Alerts
Displays all active alerts.
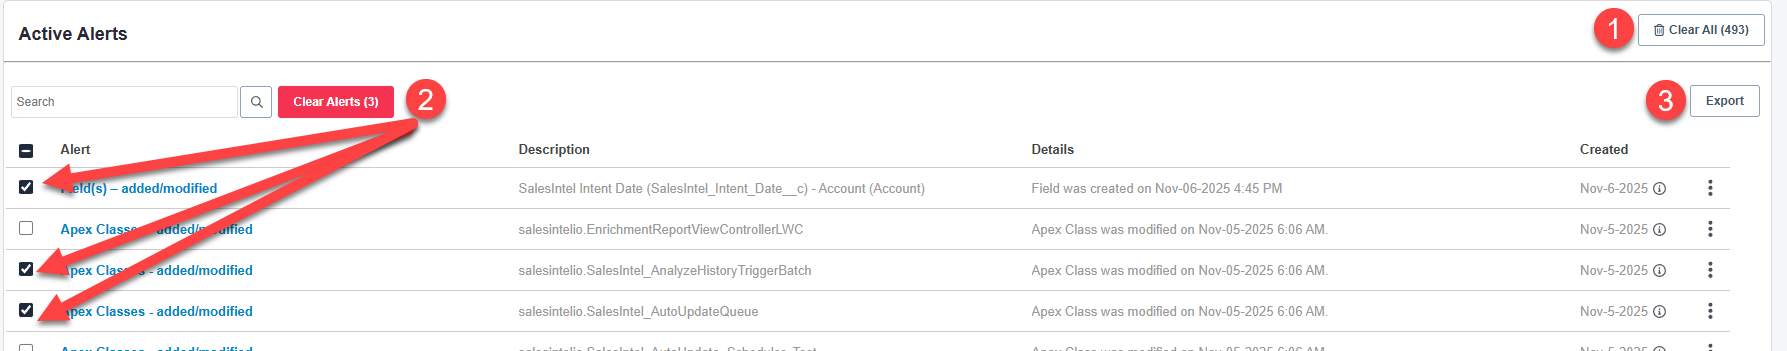
1. Clear All: Removes all alerts.
2. Clear Alerts: Removes selected alerts.
3. Export: Exports alerts to CSV.
Menu Options
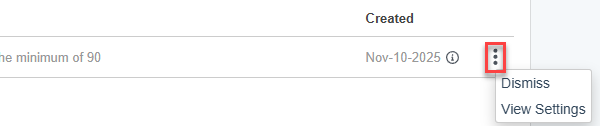
Dismiss: Delete individual alert.
View Settings: View, enable, disable, or modify alert settings.
Alert Settings
Expand each section to manage alert categories and configuration.
Toggle Enabled to activate specific alerts.
.gif)
Select the Settings icon to edit alert settings or configure email delivery preferences.
Email Notification Options
Option | Description |
|---|---|
Timely | Sends emails immediately after detection. |
Daily | Sends a daily summary at a scheduled time. |
Weekly | Sends a weekly summary on a specified day/time. |
Email Recipients:
Enter one or more email addresses (one per line; use tab between email entries).
Note: Some alerts can only be scheduled for timely, daily, or weekly alerts (limitations are automatically applied in selections available). Others will have multiple options available.
Dashboard Icons
Icon | Meaning |
|---|---|
| Timely alerts enabled |
| Daily alerts enabled |
| Weekly alerts enabled |


Note: Alerts enabled without an email delivery option will appear silently in the Alerts dashboard only.
Alert Categories
App Updates
App installed
Trigger added/modified
Field added/modified/deleted
Object added/modified/deleted
App version change
App uninstalled
App without Salesforce Security Review (unmanaged/beta)
Apex code coverage drops below 75%
Apex Class added or modified
Data Quality
Alerts when Cloudingo’s Data Quality score falls below a set threshold.
API & Storage
Trigger using deprecated API version
Apex Class using deprecated API version
API usage exceeds 80% threshold
Storage Usage exceeds 80% threshold
Usage
Idle User: Alerts when a user has not logged in for 30 days.
Active user with no logins
Reasons to Monitor:
Cost Savings: Identify unused Salesforce licenses.
Adoption Insight: Track user engagement.
Security: Disable inactive users to prevent risk.
Security
IP whitelist range without description
IP whitelist range added or modified
Deprecated TLS protocol or ciphers logins
Logins from unauthorized geographic regions
Salesforce security settings modified
Instance Alerts
Trust Degradation: Reports active Salesforce instance issues.
Trust Maintenance: Reports scheduled maintenance windows.
Permissions Required
Salesforce Permissions
Metadata: “Modify Metadata Through API Functions” permission.
Tooling API: “API Enabled” permission.
App Details: “Download AppExchange Packages” permission.
Cloudingo Permissions
Cloudingo Admins can permit or restrict user access to the Intelligence Dashboard via roles assigned to the user.
The role name is ‘Cloudingo Intelligence Dashboard’.
Only Admin Cloudingo users will have access initially.
All user roles (including the Super-User role) will not have access unless explicitly granted by an Admin user.